Alliance Charts
Chart 1 - OSHA Alliances by Fiscal Year
OSHA Alliances by Fiscal Year - Text Version
Chart Title: OSHA Alliances by Fiscal Year (as of September 30, 2020)
Chart Type: Line Plot
Chart Elements: 16 plots - 2005, 2006, 2007, 2008, 2009, 2010, 2011, 2012, 2013, 2014, 2015, 2016 2017 2018 2019, and 2020 with the cumulative number of Total, Regional/Area Office and National Active Alliances.
Values:
Total Alliances
- 2003 = 106
- 2004 = 242
- 2005 = 346
- 2006 = 390
- 2007 = 405
- 2008 = 432
- 2009 = 383
- 2010 = 327
- 2011 = 296
- 2012 = 301
- 2013 = 289
- 2014 = 264
- 2015 = 229
- 2016 = 237
- 2017 = 233
- 2018 = 244
- 2019 = 241
- 2020 = 236
Regional/Area Office Alliances
- 2003 = 69
- 2004 = 175
- 2005 = 279
- 2006 = 321
- 2007 = 340
- 2008 = 367
- 2009 = 331
- 2010 = 286
- 2011 = 259
- 2012 = 265
- 2013 = 255
- 2014 = 230
- 2015 = 200
- 2016 = 207
- 2017 = 202
- 2018 = 211
- 2019 = 205
- 2020 = 199
National Alliances
- 2003 = 37
- 2004 = 67
- 2005 = 67
- 2006 = 69
- 2007 = 65
- 2008 = 65
- 2009 = 52
- 2010 = 41
- 2011 = 37
- 2012 = 36
- 2013 = 34
- 2014 = 34
- 2015 = 29
- 2016 = 30
- 2017 = 31
- 2018 = 33
- 2019 = 36
- 2020 = 37
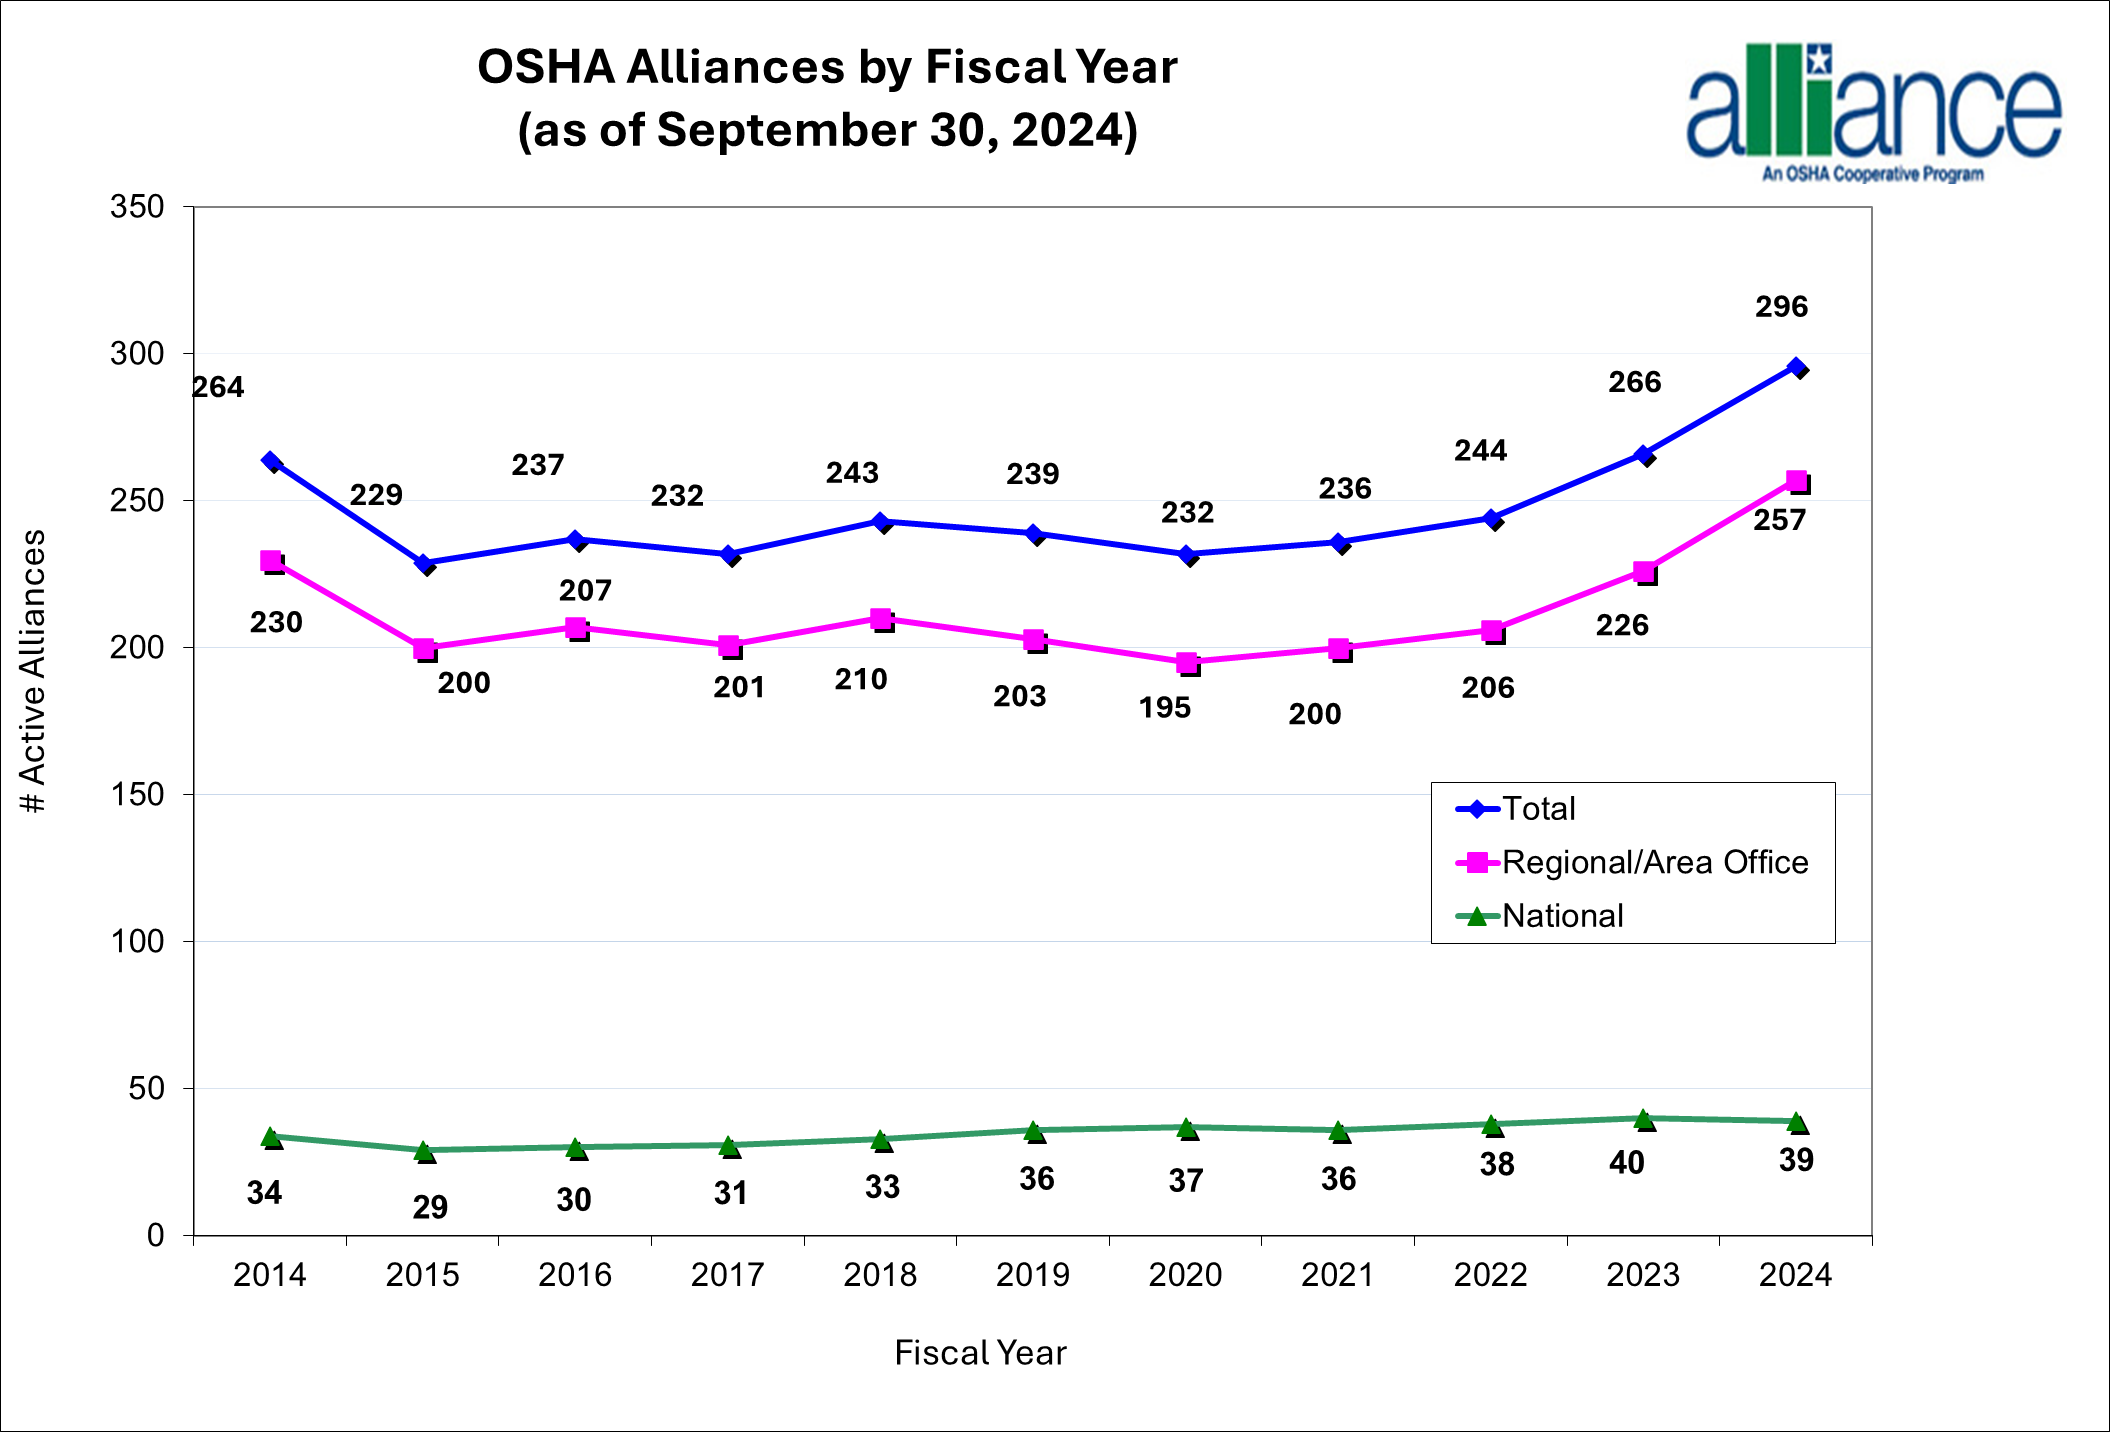
Chart 2 - OSHA Alliances by Focus Area

OSHA Alliances by Focus Area - Text Version
Chart Title: OSHA Alliances by Focus Area (as of September 30, 2020)
Chart Type: Column
Chart Elements: 7 categories - Construction, Hispanic Workers, Youth, Small Business, Chemicals, Oil and Gas, and Healthcare with the cumulative number of Total Active Alliances = 244*.
Values:
Number of Active Alliances
- Construction = 115
- Hispanic Workers = 64
- Youth = 40
- Small Business = 24
- Chemicals = 22
- Oil and Gas = 20
- Healthcare = 14
- Temporary Workers = 22
- Ergonomics = 19
*The sum of the focus areas may not equal the total number of Alliances because Alliances can have multiple focus areas and some focus areas are not shown.
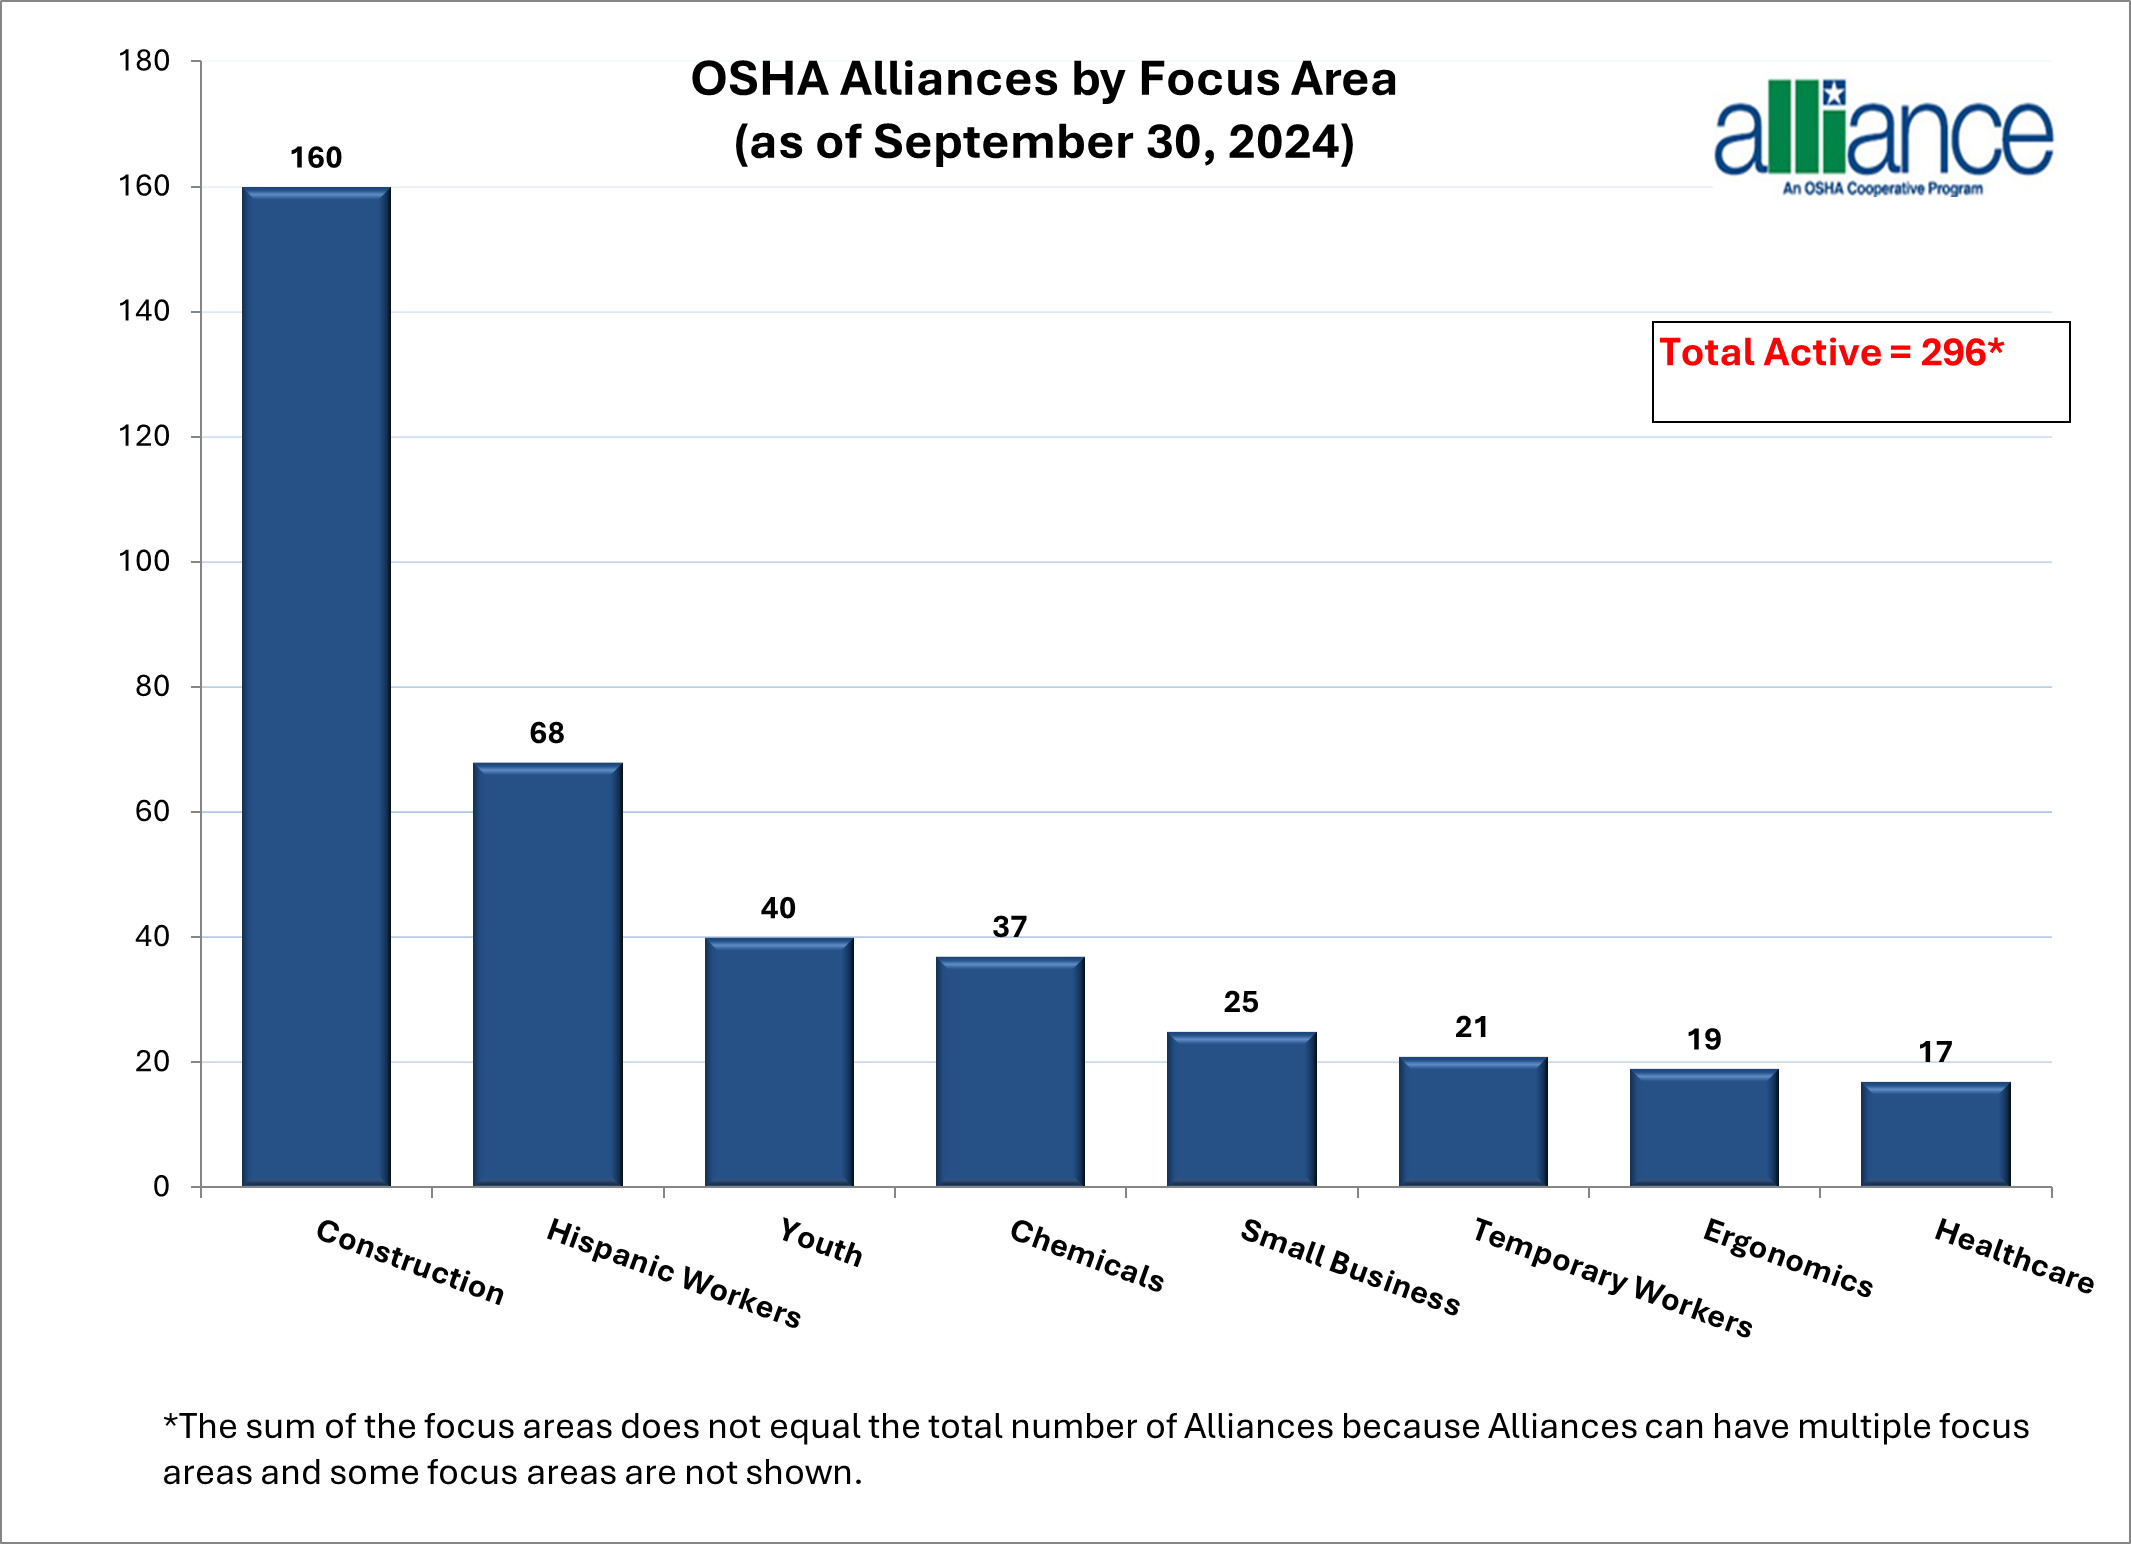
Chart 3 - OSHA Alliances by Signatory Type

OSHA Alliances by Signatory Type - Text Version
Chart Title: OSHA Alliances by Signatory Type (as of September 30, 2020)
Chart Type: Column
Chart Elements: 8 categories - Trade Associations, Consulates, Consultation Program, Professional Societies, Unions, State OSHA, Government Agency, and Community/Faith-Based with the cumulative number of Total Active Alliances = 240*.
Values:
Number of Active Alliances
- Trade Associations = 89
- Consulates = 32
- Consultation Programs = 29
- Professional Societies = 23
- Unions = 20
- State OSHA = 21
- Government Agency = 13
- Community/Faith-Based = 3
*The sum of the signatory types may not equal the total number of Alliances because Alliances can have multiple signatory types and some signatory types are not shown.