
Voluntary Protection Programs
Voluntary Protection Programs (VPP) recognize employers and workers who have strong safety and health programs and low injury rates. In VPP, employers, workers, and OSHA work together to prevent injuries and illnesses through training, hazard prevention, and active involvement from both management and employees. To join, employers apply to OSHA and complete an onsite review by safety and health experts. Participants are reviewed every three to five years and are not subject to OSHA programmed inspections while they keep their VPP status.

Explore how VPP promote strong workplace safety and health by bringing together employers, workers, and OSHA.

The VPP were designed primarily for fixed worksites, however mobile workforces and corporations can also participate.

Policy Guidance
Review VPP policies, procedures and guidance.
- Voluntary Protection Programs Policies and Procedures Manual (CSP 03-01-005)
- Revisions to the VPP to Provide Safe and Healthful Working Conditions
Guidance
Participant Information
Find participants by:
Resources
- BLS Injury and Illness Case Rates
- Use of VPP Logo
- VPP Star Worksite Flag
- Partner Link: VPP Participants' Association
Reports
IMPORTANT:
For more information on becoming a VPP participant, contact OSHA's Office of Partnerships and Recognition at (202) 693-2213 or email your VPP Manager.
Black & Veatch VPP Star Approval Ceremony
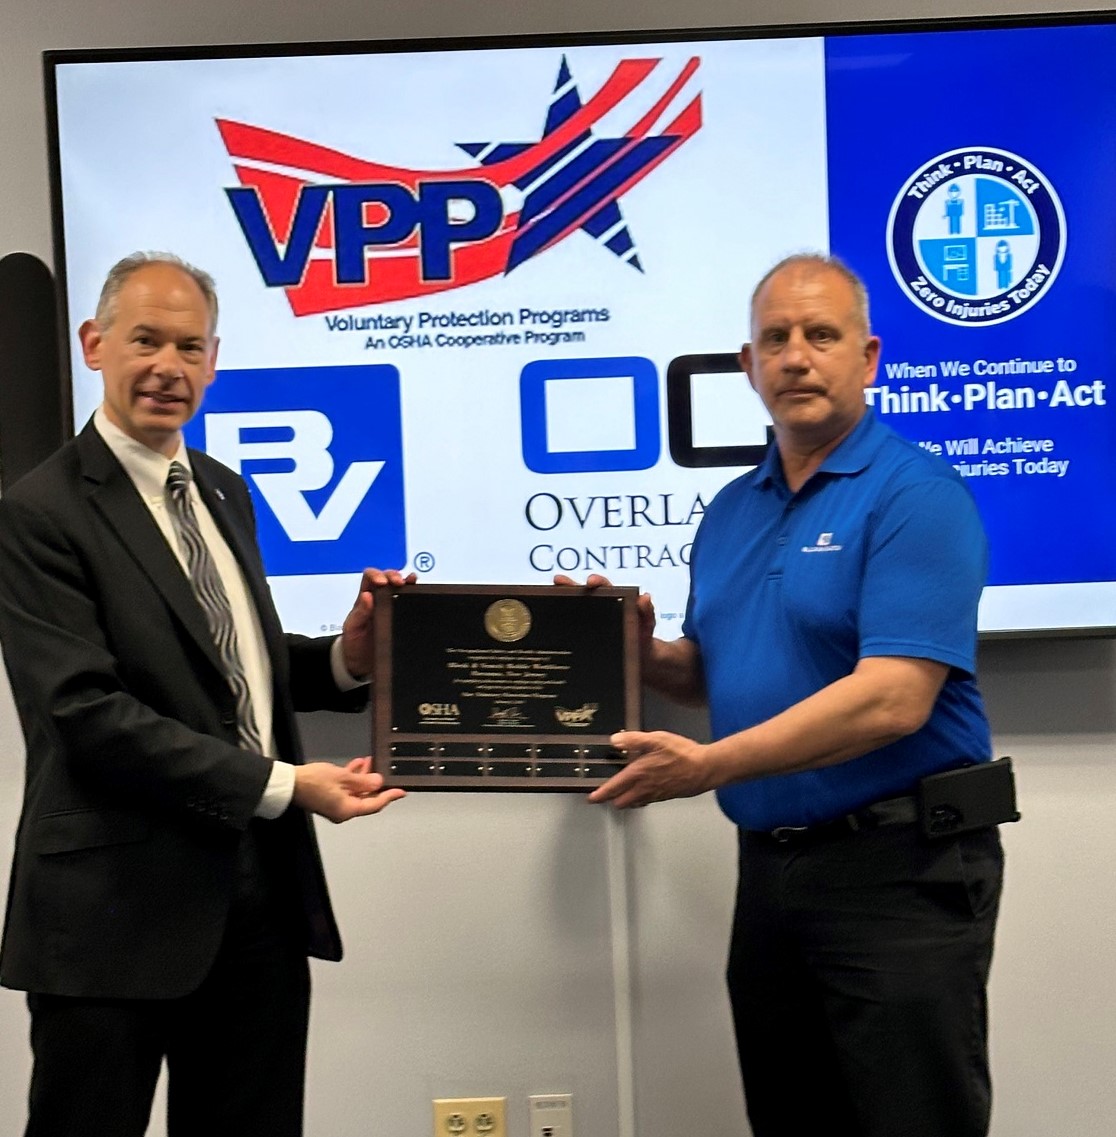
(left to right) : OSHA Regional Administrator, Richard Mendelson with Black & Veatch, NYNJ Telecom Market, ESH&S Manager, Edward Williams.
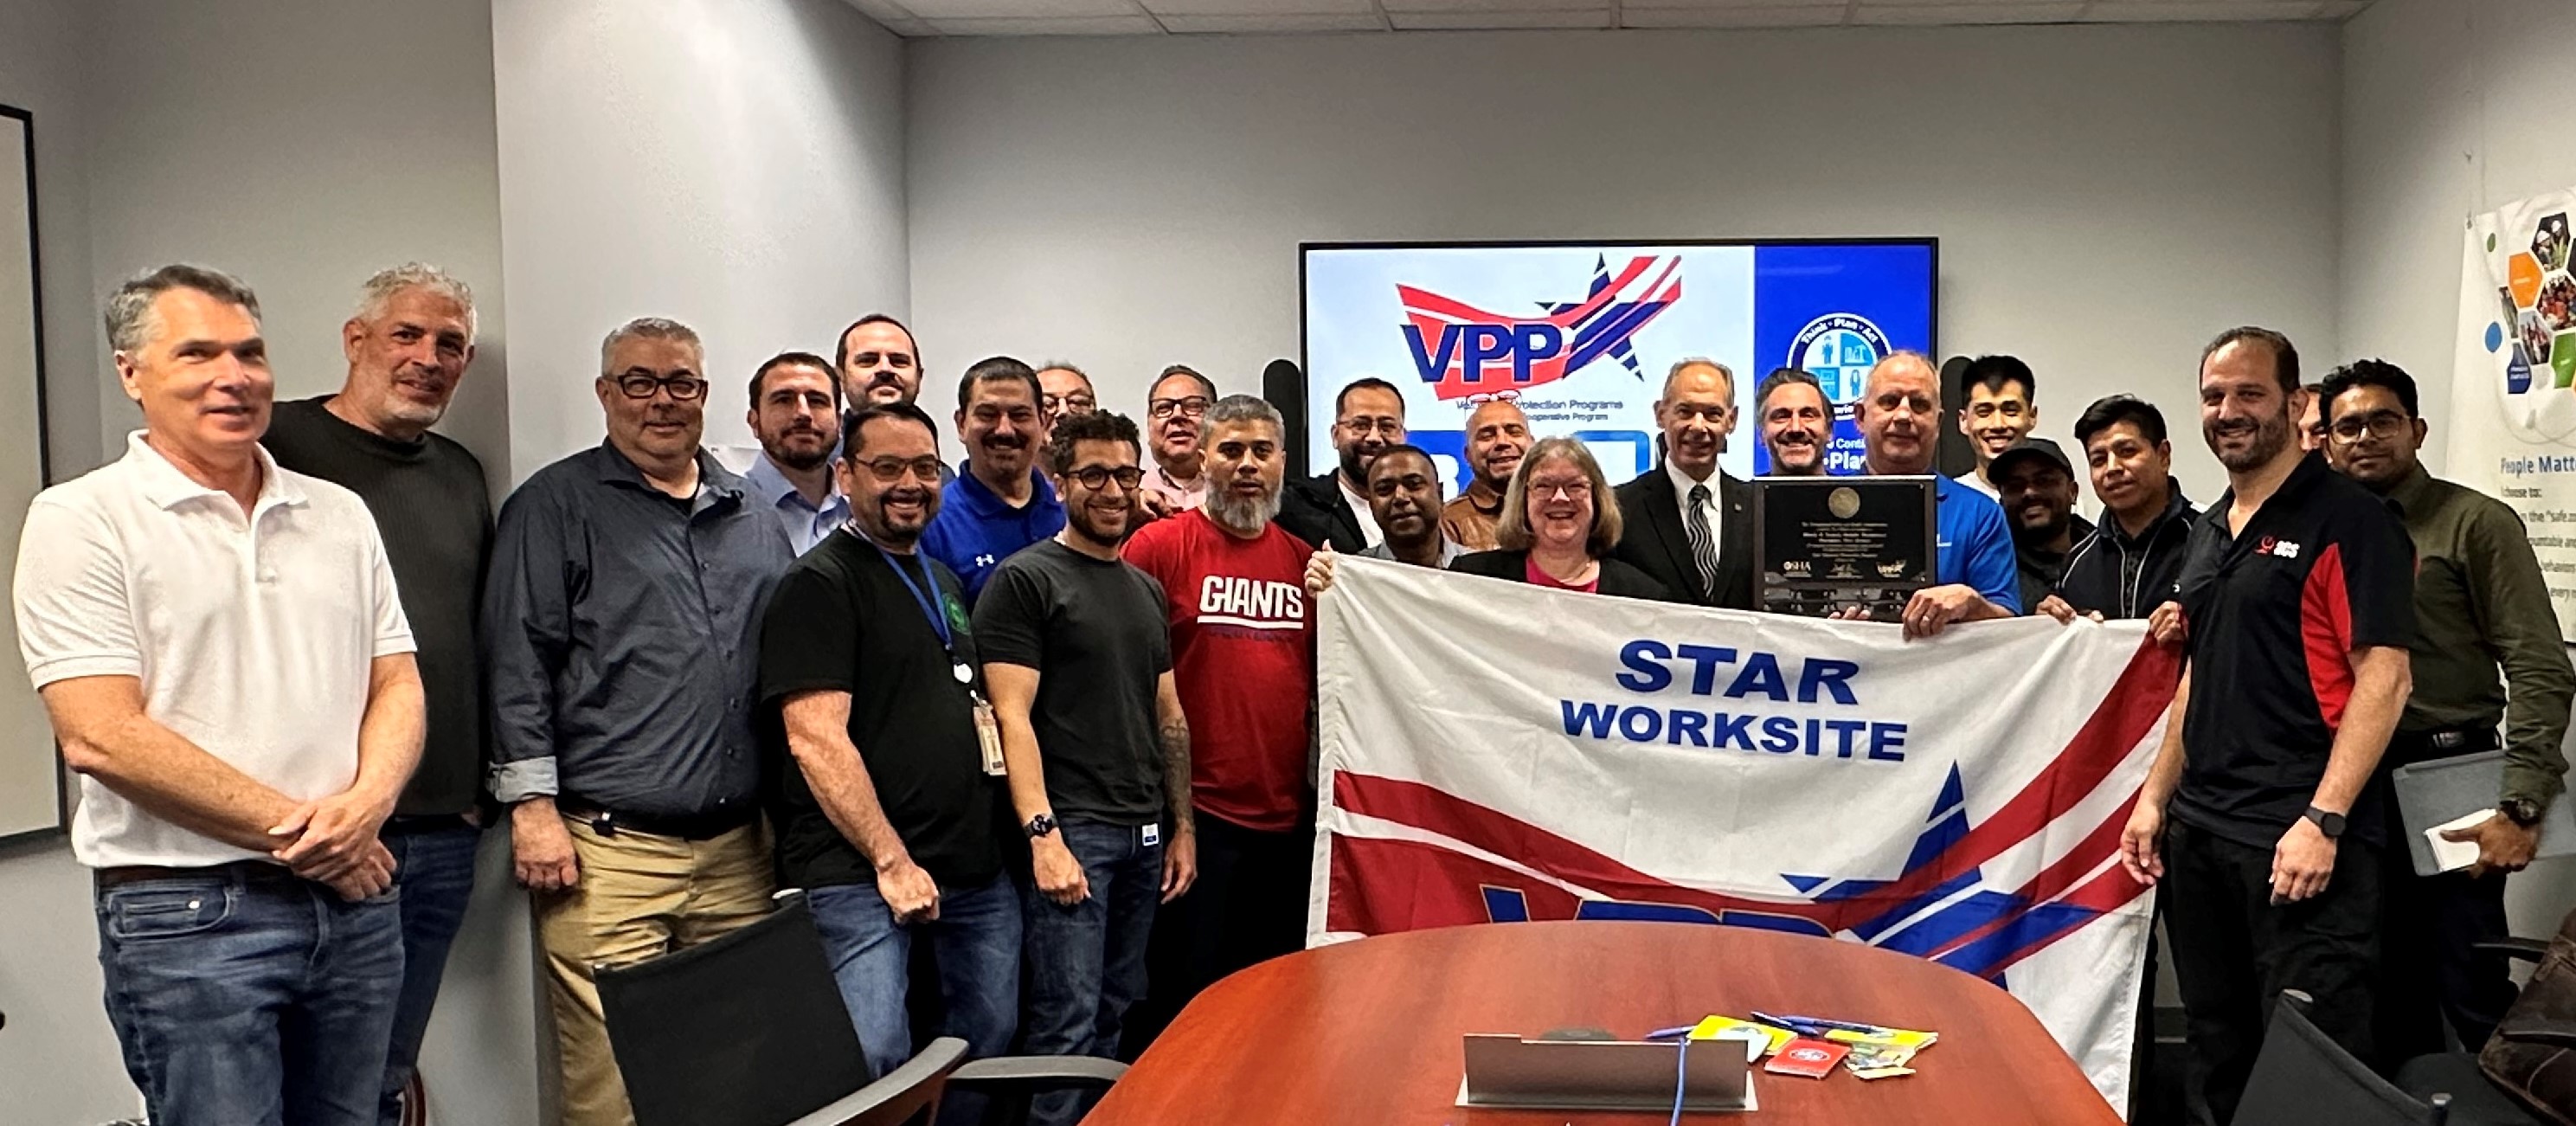
OSHA Regional Administrator, Richard Mendelson, OSHA Area Director, Lisa Levy with Black & Veatch personnel at the VPP Star approval ceremony on May 7, 2024
Photo: McWane Ductile VPP Onsite Recertification, Phillipsburg, N.J.
