Helping Small Businesses

OSHA provides safety and health resources specifically designed for small businesses. Find information on complying with OSHA standards and receive advice you can trust through OSHA's no-cost and confidential On-Site Consultation Program.
Compliance Guides
- Small Business Compliance Guides:
- Abatement Verification Regulation
- Beryllium in General Industry
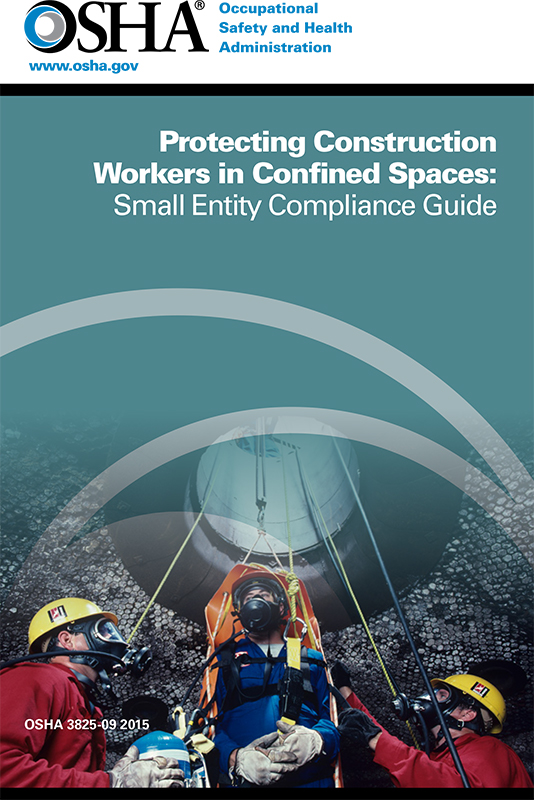
- Confined Spaces
- Cranes and Derricks in Construction
- Ethylene Oxide
- Hazard Communication
- Hexavalent Chromium Standards
- Methylene Chloride
- Process Safety Management
- Respirable Crystalline Silica Standard for Construction
- Respirable Crystalline Silica Standard for General Industry and Maritime
- Respiratory Protection Standard
- Woodworking
- Compliance Assistance Quick Starts
- Online Tools
- Get Help from Compliance Assistance Specialists